By L8MS Team · Updated 10 Nov 2026
AE Reports › KPI Report › Nonconformities turns nonconformity data into figures and charts.
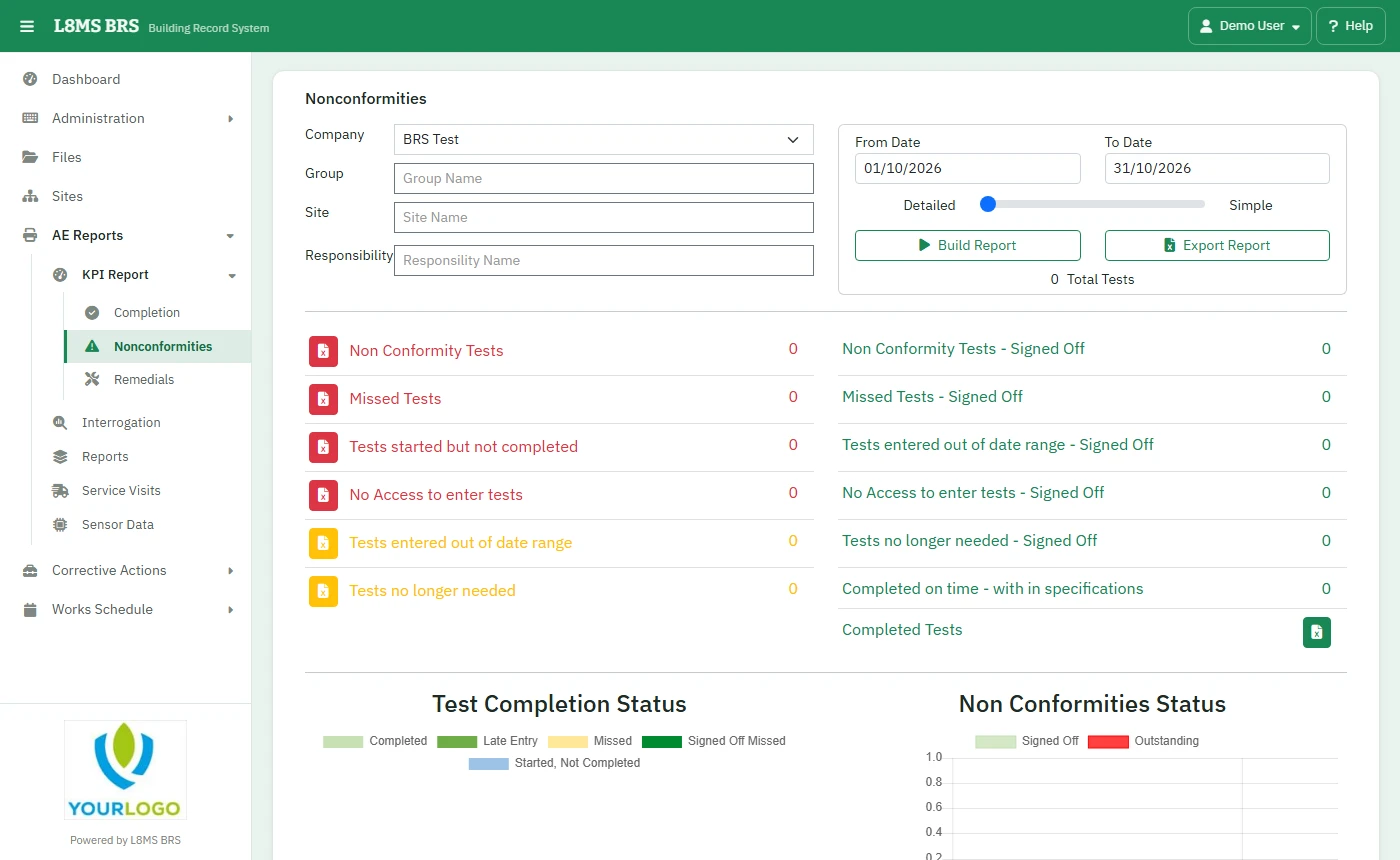 KPI: nonconformities.
Steps
Choose the Company and narrow by Group, Site and Responsibility. Set the From Date and To Date.
Choose Detailed or Simple and click Build Report.
Read the KPI Overview, Test Completion Status and Non Conformities Status charts.
Export Report downloads it. The export buttons download the tests behind each figure: nonconformities, outstanding missed tests, tests started but not completed, no access, data entered in arrears, not needed, and all completed tests.
Grouped by responsibilityFigures are grouped by the responsibility on each task, so keep task responsibilities right.